Understanding Dyno Correction Factors and Their Impact on Performance Numbers
When evaluating engine performance using a dynamometer (dyno), it’s essential to understand the role of dyno correction factors. These factors adjust test results to account for varying environmental conditions that influence engine output. In this article, we’ll break down what dyno correction factors are, how they affect performance numbers, and why they matter for accurate engine testing.
What Are Dyno Correction Factors?
Atmospheric conditions, such as humidity, barometric pressure, and temperature, significantly impact engine performance. While we can control testing procedures, the weather is unpredictable and beyond our control. For instance, an engine tested at 5,200 feet in Denver will produce less power than the same engine tested at sea level. This discrepancy occurs because high-altitude conditions result in thinner air, reducing engine efficiency.
To maintain consistency and ensure reliable comparisons, dyno software applies a correction factor. This factor doesn’t alter engine output but adjusts the raw data to a standard set of conditions, making performance numbers comparable across different tests. Correction factors are calculated using a multiplier based on the current weather, and they either raise or lower the dyno results accordingly.
Common Dyno Correction Factors
Several correction factors are commonly used in the industry. Here are some of the most frequently applied weather corrections:
- Uncorrected: This shows the raw data from the test, reflecting the actual atmospheric conditions at the time.
- SAE Correction: The Society of Automotive Engineers (SAE) standardizes the correction to 77°F, 29.60″ barometer, and 36% humidity.
- STD Correction: This correction uses 60°F, 29.92″ barometer, and 0% humidity. It typically results in 2-4% higher numbers than SAE.
- DIN Correction: Following the German standard, this factor uses 68°F, 29.92″ barometer, and 0% humidity.
- JIS Correction: The Japanese Industrial Standard applies 77°F, 29.234″ barometer, and 0% humidity.
SAE vs. STD: The Ongoing Debate
Among the various correction factors, SAE and STD are the most commonly used by dyno shops and enthusiasts. SAE correction is considered the benchmark and is mandated by most manufacturers. SAE J1349 offers “a fair and consistent way to measure engine power and torque”, as detailed in their official documentation.
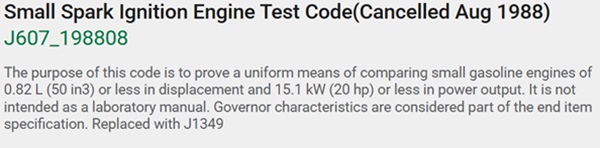
On the other hand, STD correction results in 2-4% higher numbers than SAE. Originally developed in the 1950s for small gasoline engines “as a uniform means of testing small gasoline engines under 20 horsepower.” The STD correction was intended to provide uniform testing for engines under 20 horsepower. However, the STD standard was canceled in 1988, as it was replaced by the SAE J1349 standard, which continues to be the industry norm.
To dive deeper into understanding how dyno charts are read and interpreted, check out this article: How to Read a Dyno Chart.
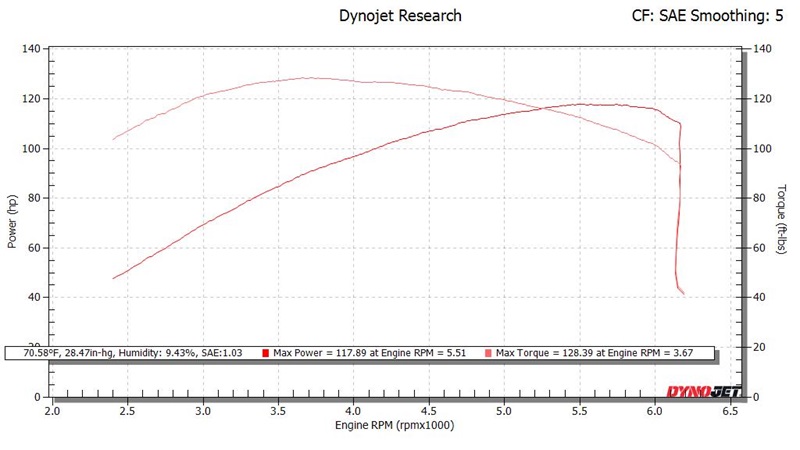
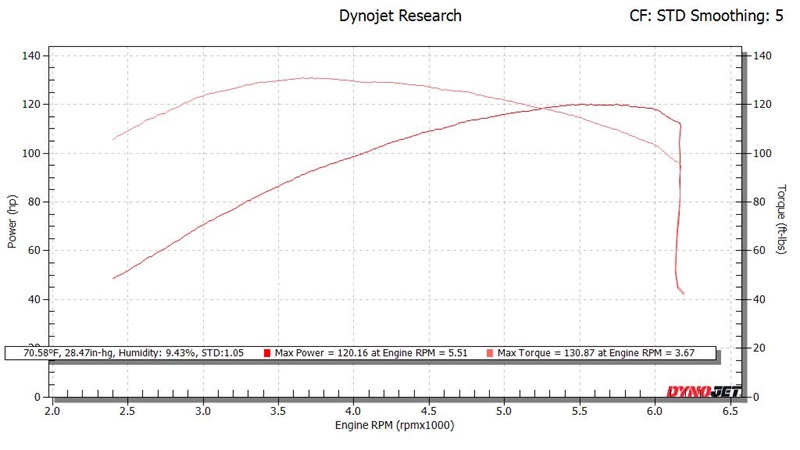
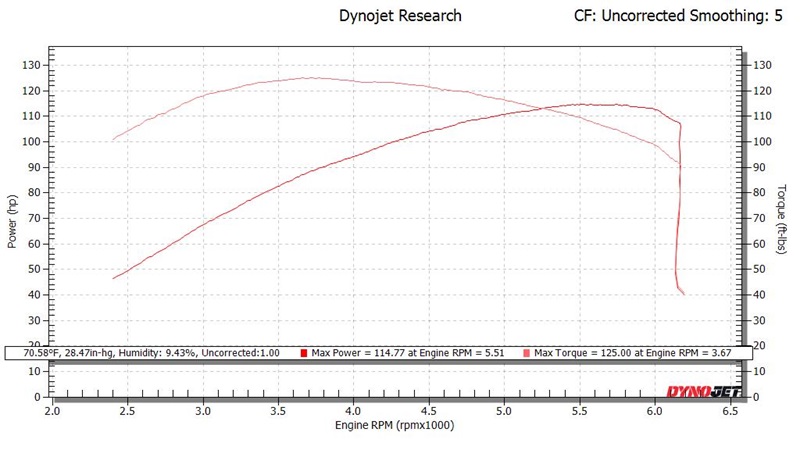
Dyno Correction Factors SAE vs STD Examples
The examples below are the same dyno run file expressed with SAE correction factor, STD correction factor, and Uncorrected (raw) form.
Conclusion
Understanding dyno correction factors is crucial for accurately assessing engine performance. While raw data can be helpful, correction factors ensure that tests are consistent and comparable, regardless of environmental changes. Whether you prefer SAE or STD correction, it’s important to know how each factor influences the results, so you can make informed decisions based on accurate, standardized data.
Sources for Understanding Dyno Correction Factors
SAE International (Society Automotive Engineers)